인과추론의 데이터과학. (2021, Sep 9). [Session 5-1] 준실험 연구사례 1: 모바일 커머스가 쇼핑 패턴에 미치는 영향 [Video]. YouTube.
인과추론의 데이터과학. (2021, Sep 12). [Session 5-2] 준실험 연구사례 2: 스마트 스피커가 컨텐츠 소비에 미치는 영향 [Video]. YouTube.
Session 5-1
Intro
- Mobile searching
- 모바일에서 컴퓨터보다 구글 검색이 활발했음
- Retail 관점: 매장에서도 80% 유저가 모바일로 검색을 했음 (OuterBox 2021)
- E-commerce 환경에서 제품별로 Sales distribution이 다를 수 있음
- Sales distribution
- 정의: 제품이나 서비스의 판매량이나 매출액이 어떻게 분포되어 있는지 의미
- Amazon’s Head & Tail product strategy
- 인기 있는 제품의 가격을 낮추는 것으로 traffic을 늘리는 것
- 손실을 tail product를 활용해서 메꾸는 방식
- ex. Head(핸드폰), Tail(충전기, 차량용 거치대)
Research Question
- 모바일 채널과 PC 채널의 sales distribution의 차이는 어떻게 되는가?
- Mobile 채널을 채택했을 때, 검색 활동과 sales distribution 효과는 어떻게 되는가?
- 제품 카테고리별 adoption effect는 어떻게 달라지는가?
선행 연구
- Long-Tail Phenomenon
- Online markets: 낮은 재고 비용, 검색 도구 → 다양한 제품을 취급할 수 있게 됨 → 소비자의 많은 검색 활동
- Various markets: 책, 의류, 음악, 비디오, DVD
- Mobile Channel
- Supply side: PC, mobile 채널 모두 electronic 채널
- Consumer side → Sales distribution에 영향을 줄 수 있음
- Search affordance: 언제 어디서든 검색할 수 있음
- Search constraints: 작은 스크린, 검색 기능의 제한성
- Product category
- 기존 연구: 사용자의 취향이 다양할 수 있는 제품군을 대상으로 선정한 것으로 보임
- ex. 여성 의류, VOD
- Gini index: 0.35 ~ 0.98
- 기존 연구: 사용자의 취향이 다양할 수 있는 제품군을 대상으로 선정한 것으로 보임
가상 시나리오
- User-level
- PC-Mobile buyer: PC, mobile 모두 활용해서 구매
- PC-only buyer: PC만 활용해서 구매
- Product Category-level
- Convenience goods: 더이상의 정보가 필요 없는 제품군 (이미 잘 알고 있는 것)
- Shopping goods: 심도 있는 고민을 해야 하는 제품군 (취향을 잘 모르거나, 원하는 것을 못 찾은 것)
- Preference goods: 사용자의 취향에 기반하여 평가할 수 있는 제품군 (ex. 의류, 신발, 액세서리)
- Quality goods: 객관적인 지표를 평가할 수 있는 제품군 (ex. 제품 용량, 보증 기간)
데이터
- 실험적으로 어려움이 있었음 → 그룹별 사용자를 분리해서 setting 하기가 어려움
- 허시 실험 환경을 사용
- 특징: 실험자들이 실험에 참여하는 사실을 알고 있음 → 실험 결과에 영향을 미칠 수 있음
- 국내 온라인 쇼핑몰로부터 데이터를 얻음
- 허시 실험 환경을 사용

모바일 채널과 PC 채널 비교
- Order matching 활용 + 매칭 변수들이 통계적 차이가 없도록 설정

- 검증
- Lorenz Curve
- Gini coefficient
- Log-linear relationship
- Lorenz Curve: 모바일 채널에 몰려있음
- 불평등 지수를 시각화하는 도구
- 평등하다면 로렌츠 곡선은 45도 각도를 가짐
- 로렌츠 곡선 아래의 면적 = 불평등 정도
- Gini coefficient: 모바일 채널에 몰려있음
- Mobile: 0.361
- PC: 0.277
- Log-linear relationship: 모바일 채널 계수 절댓값이 PC보다 컸음

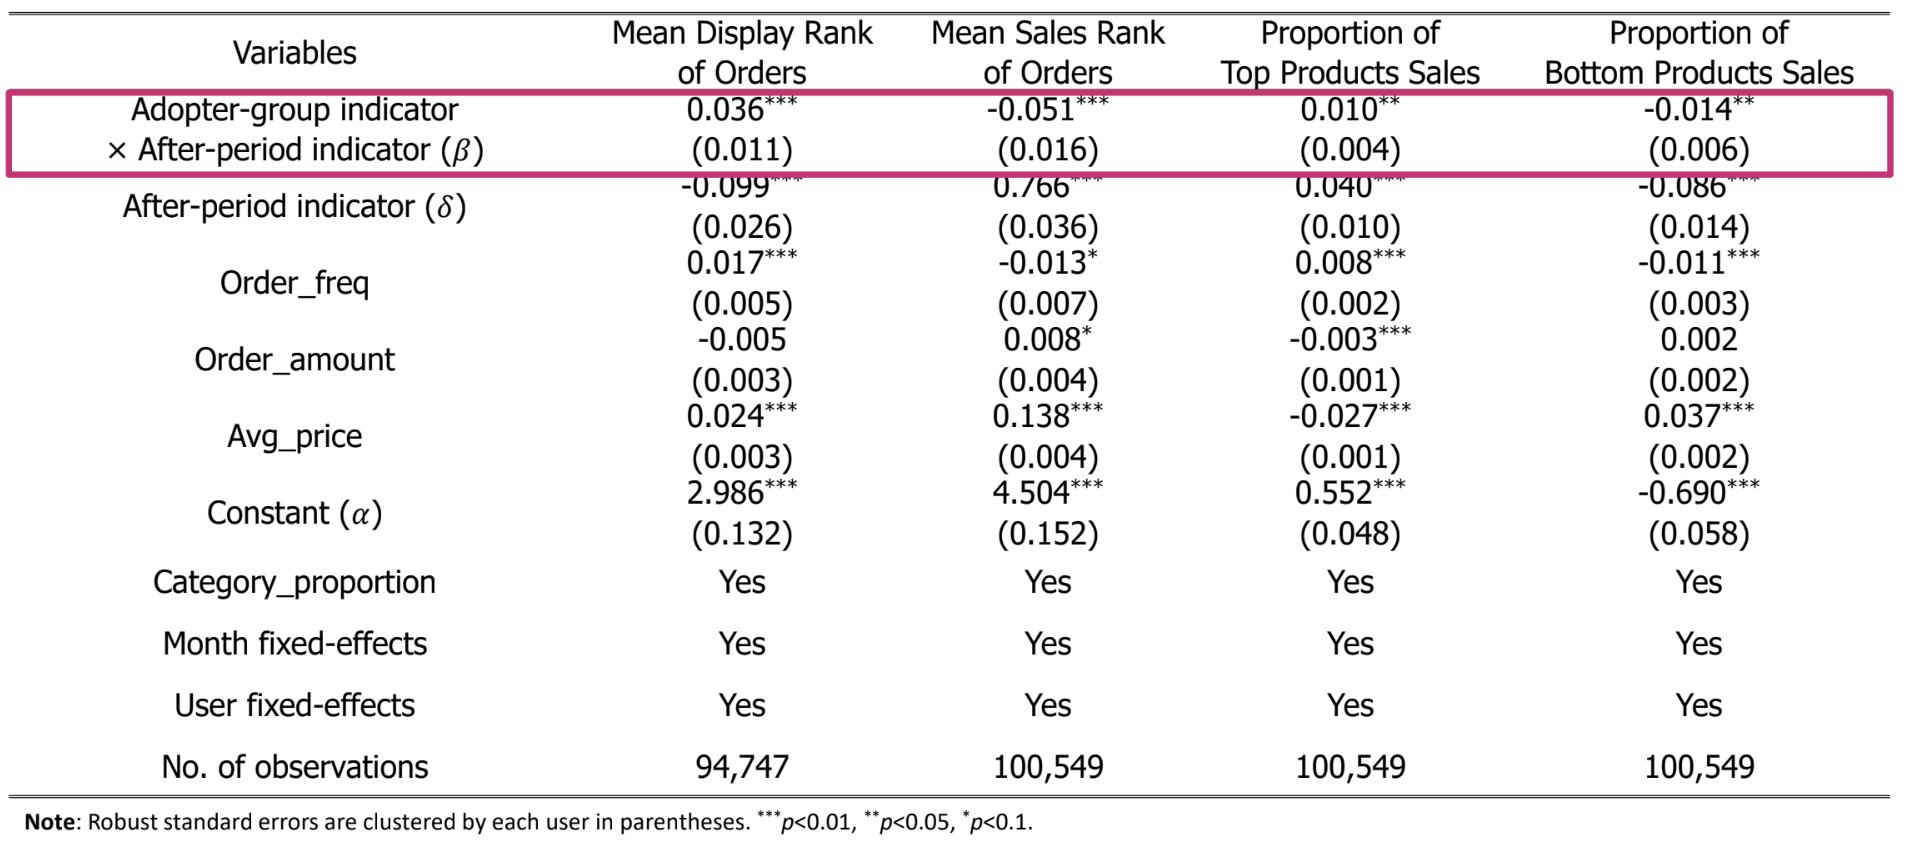
모바일 채널의 채택 효과
- 데이터 보정 (기준: Order → User-Month)

- PC-Mobile buyers와 PC-only buyers의 유저 매칭 진행
- 매칭 변수
- 구매 이력: 상품 다양성, RFM 변수
- demographic 정보: gender, age dummy
- DID 분석 진행
- treatment: 첫 모바일 구매
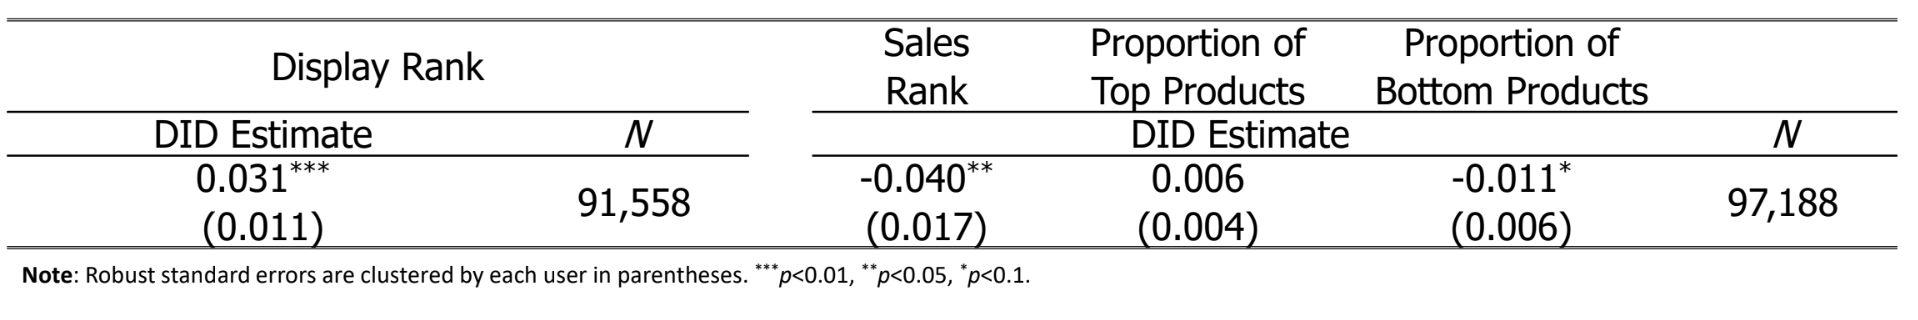
- 거래 이후 모바일 채널의 채택 효과 분석 → 검색을 더 많이 하지만, 인기 있는 제품에 몰렸음

Robustness Checks
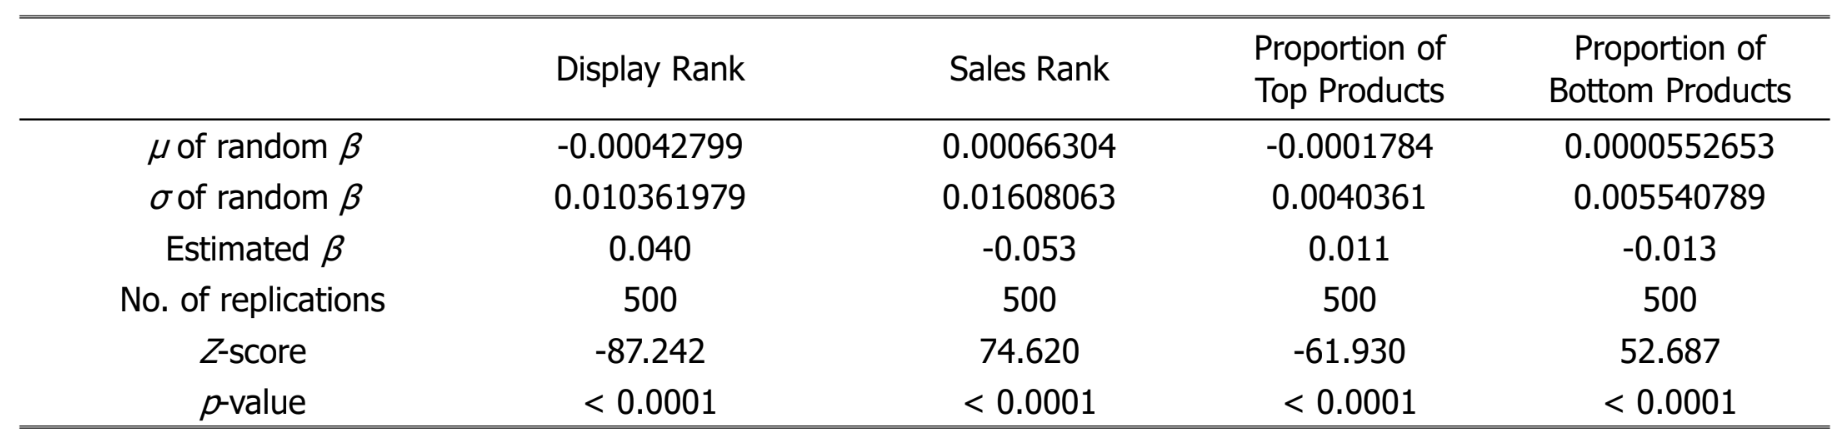
- Parallel Assumption Check
- DID 분석을 할 때, 가장 먼저 수행해야 하는 분석
- 통계적으로 보이기 위해, Random placebo treatments 사용
- pre-/post-treatment의 기간을 랜덤 하게 배정
- 500번 시도하여 평균과 표준편차 추정치 계산

- Different Specifications and Matching Techniques
- 다른 기준 및 매칭 기법으로 확인했을 때, 결과가 유지되었음


- User Fixed-effects
- DID에 user fixed-effects를 넣어도 결과가 robust 하게 보임
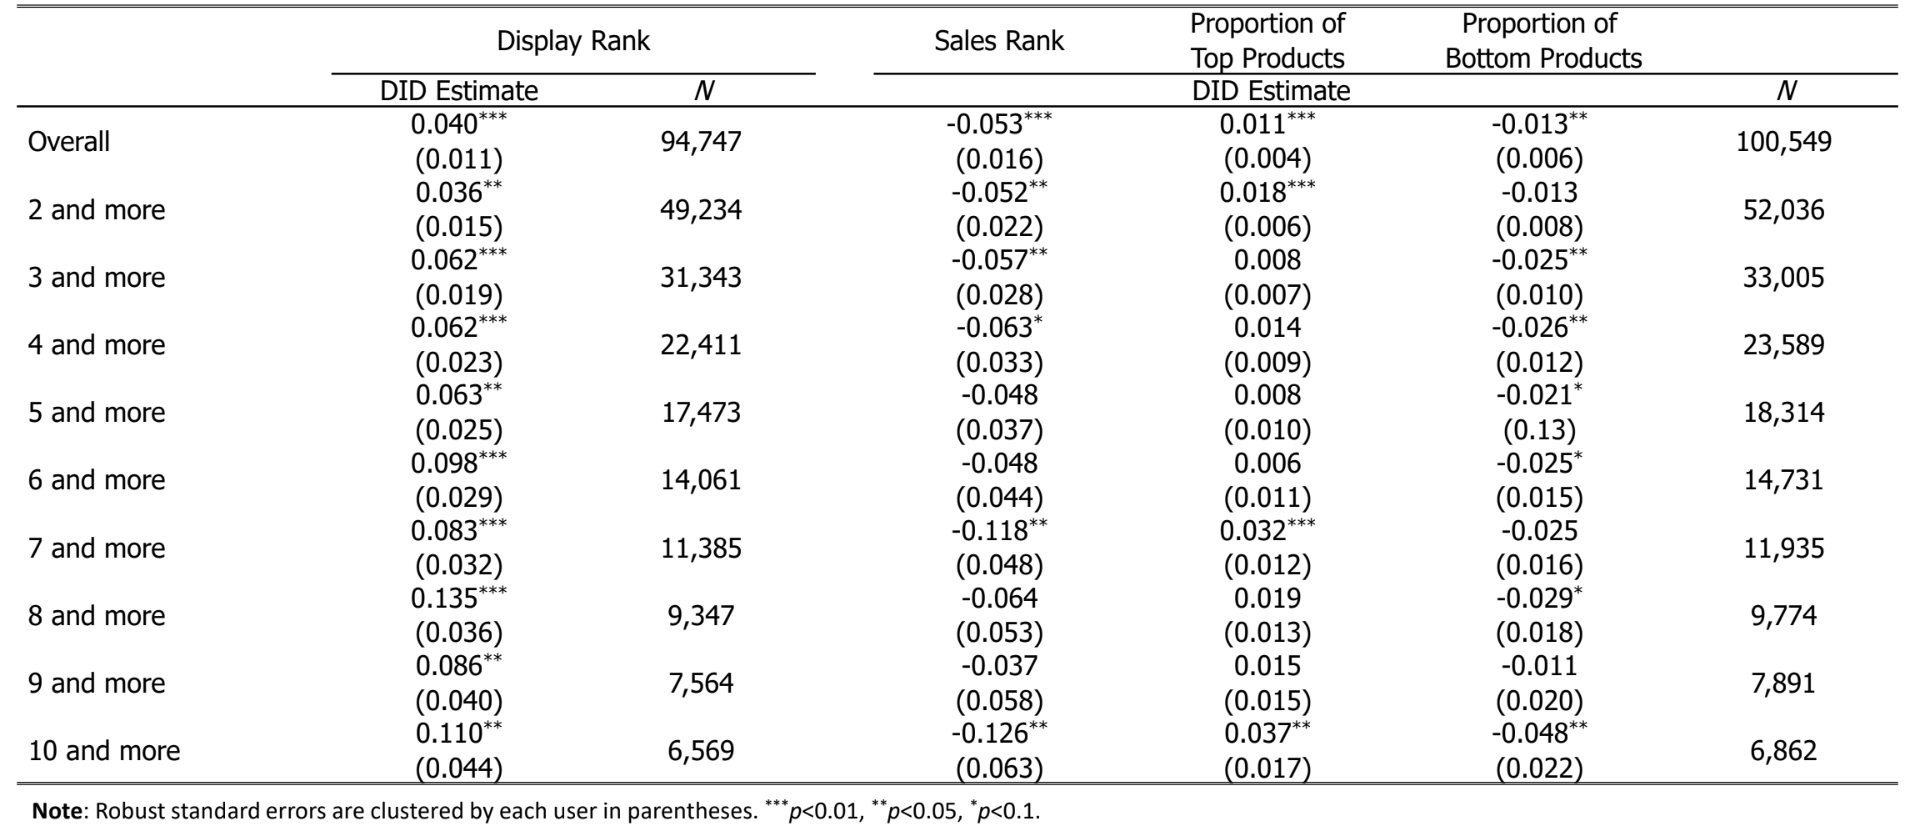
- Different Definitions of PC-Mobile Buyers
- 초기 treatment: 1번이라도 모바일 채널을 활용하여 구매
- 여러 번 모바일 채널을 활용하여 구매한 사람들을 treatment 그룹으로 정의하여 분석해도 결과가 유사하게 나왔음
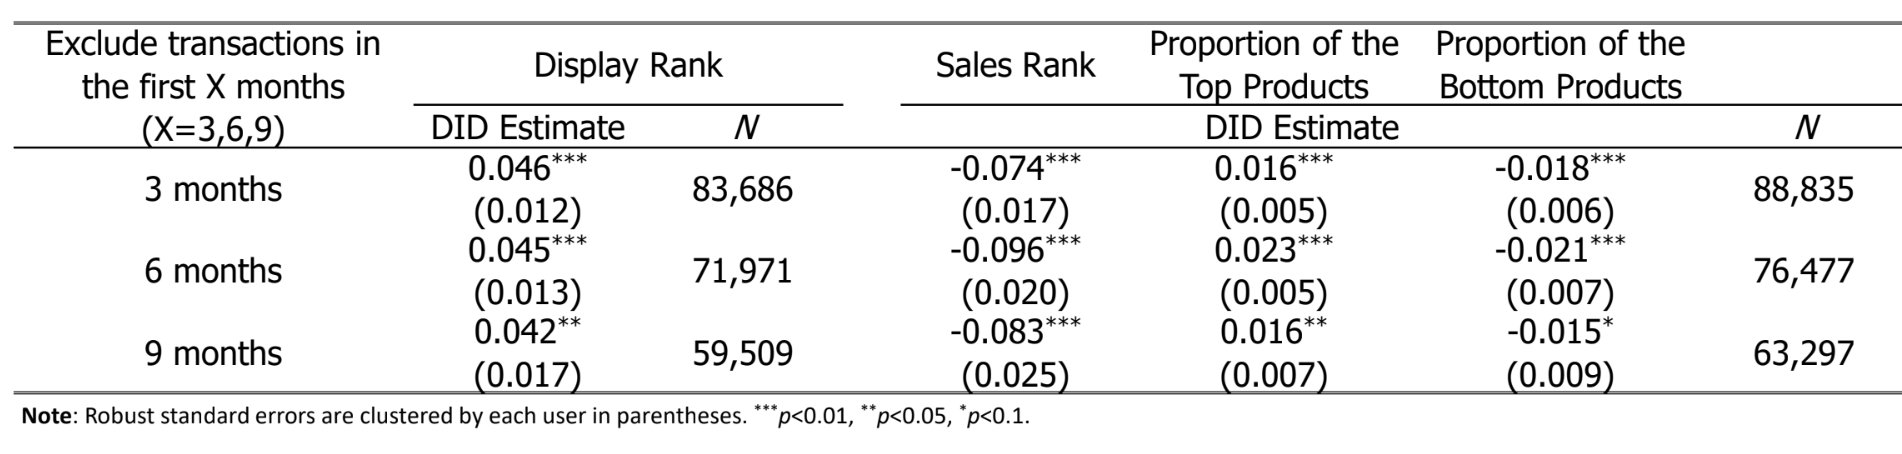
- Hawthorne Effect
- 변화를 감지했을 때, 심리적 요인이 발생하는 설명을 배제하기 위한 시도를 함
- 초기의 기간에 대한 결과를 제거하고 분석해도 결과가 유사하게 나왔음
- Falsification Test: Random placebo treatments
- Falsification Test: 가설이 틀렸는지를 확인하는 것에 초점 (위조 검정)
- 랜덤 하게 treatment 그룹을 배정하여 결과가 유의미하지 않게 나오는 것을 확인
- Transactions in the PC Channel
- PC-Mobile buyers: 모바일 채널 구매 이력을 제외하고 PC 채널만 봐도 결과가 유사
- PC-only buyers: PC-mobile buyer에 비해 행위 자체가 적은 것으로 보임
- Products that are not subject to any filter or option
- 색상, 크기가 1개인 제품들과 같이 검색 필터와 관련이 없는 제품군의 결과도 유사했음

- First Mobile Purchase as Treatment
- 초기에는 첫 모바일 구매를 treatment로 고려했으나, 결과 해석 이후 robust 정책적으로 제외하였음

Category-level 분석
추출된 결과가 기존 롱테일의 해석과 달랐음 → 사용자가 검색을 많이 해도 Head product에 몰려서 구매했음
⇒ 단서를 찾기 위해 카테고리 레벨로 분석을 진행함
- Preference goods: 검색을 많이 하지만, 기존 롱테일과 유사하게 니치 product를 많이 샀음
- 니치 제품 (Niche product): 틈새 품목
- Quality goods: 검색을 많이 하지만, 인기 있는 제품을 많이 샀음
- Convenience goods: 검색을 덜 하고, 인기있는 제품을 많이 샀음
⇒ 제품군에 따라 다른 결과를 확인 가능 (제품 특징이 중요함)

결과
- 기존 롱테일 현상과 달랐음
- 가정: 사용자들의 취향이 다르다
- 기존: 사용자들이 온라인 채널에서 취향을 찾아가면서 니치 품목을 찾아가면서 롱테일 현상이 일어났음
- 사용자마다 취향의 정도는 제품군마다 다를 수 있음
- 검색을 많이 한다고 니치 품목을 찾아가는 것이 아니라, 인기 있는 제품에 모일 수도 있었음
- 제품군
- Preference goods
- Quality goods
- Convenience goods
Session 5-2
Voice of Commerce
- functional interactions
- emotional interactions
- asking fun question → 3위
Research objective
- Does the use of a smart speaker as a VOD search system positively influence consumers’ content purchase intensity?
- To what extent do such voice-driven searches affect consumers’ content consumption rate?
- Are consumers likely to choose more indulgent VOD content after the adoption of smart speakers?
- How does consumers’ emotional attachment with smart speakers influence their VOD purchase behaviors?
Theoretical Background
- Usage of smart speaker will have a positive impact on the intensity of content purchase behavior
- Usage of smart speaker will have a negative impact on the average completion rate of each content.
- Usage of smart speaker will have a positive impact on the purchase of uplifting contents.
- The positive impact on purchase behaviors will be more salient for households which exhibit greater emotional attachments to the smart speaker than those who mainly exhibit information- seeking behaviors during engagements with the smart speaker.
Data
- Data Period: September 2016 ~ September 2018 (24 months, monthly)
- Sample Size: 31,043 households (at least one records of VOD purchases during data period)
- VOD Data:
- VOD Usage Information :
- (1) Content purchase, start and end time
- Content Information:
- (1) Total runtime of content
- (2) Genre of content
- (3) Age restriction of content
- (4) Price of content
- VOD Usage Information :
- AI Speaker Data:
- (1) Time of contact
- (2) Speech-to-text data on a user’s verbal commands
- (3) Category of commands (search, emotional chatting and information-seeking)
- (4) Registration Date
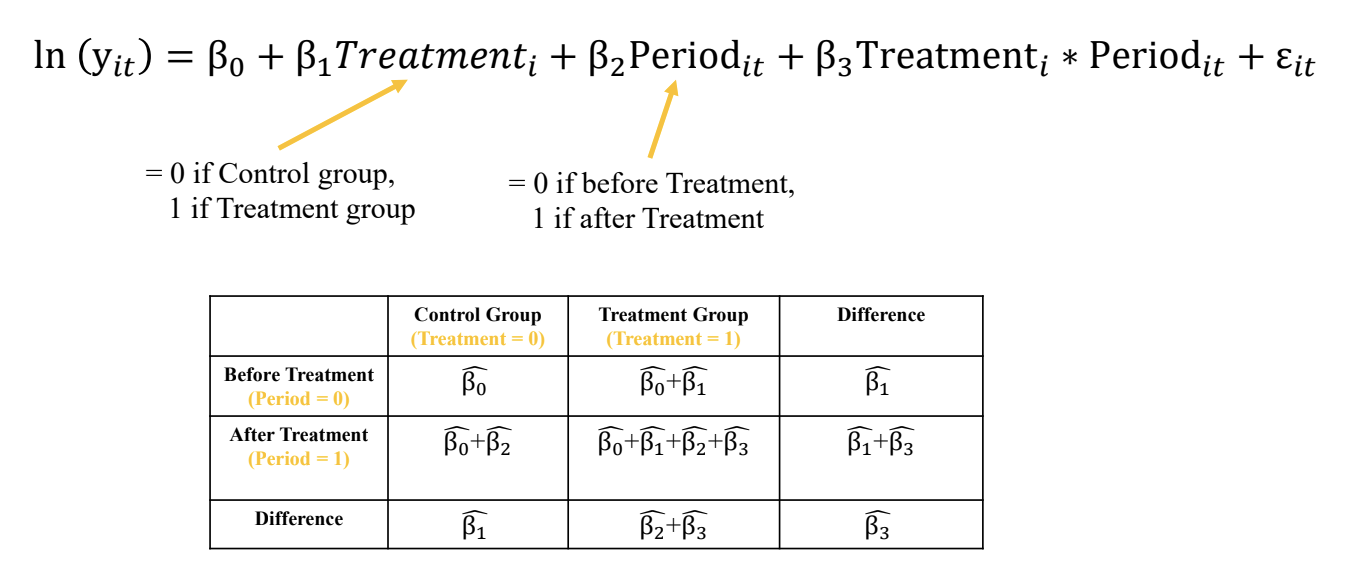
Identification Strategy (DID+Matching)
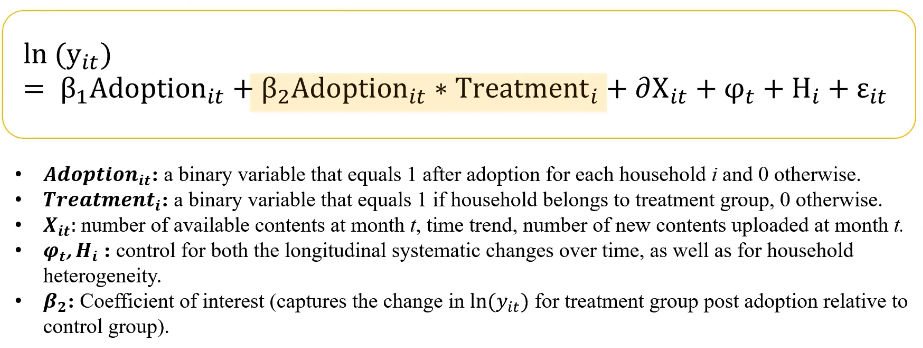
DID
PSM (propensity score matching)
- Replace multiple confounding covariates with one function of these covariates (propensity score)
- The function (propensity score) captures the likelihood of study participants receiving a treatment based on observed covariates

Look-forward Matching
- 보이지 않은 부분들은 control 불가했음
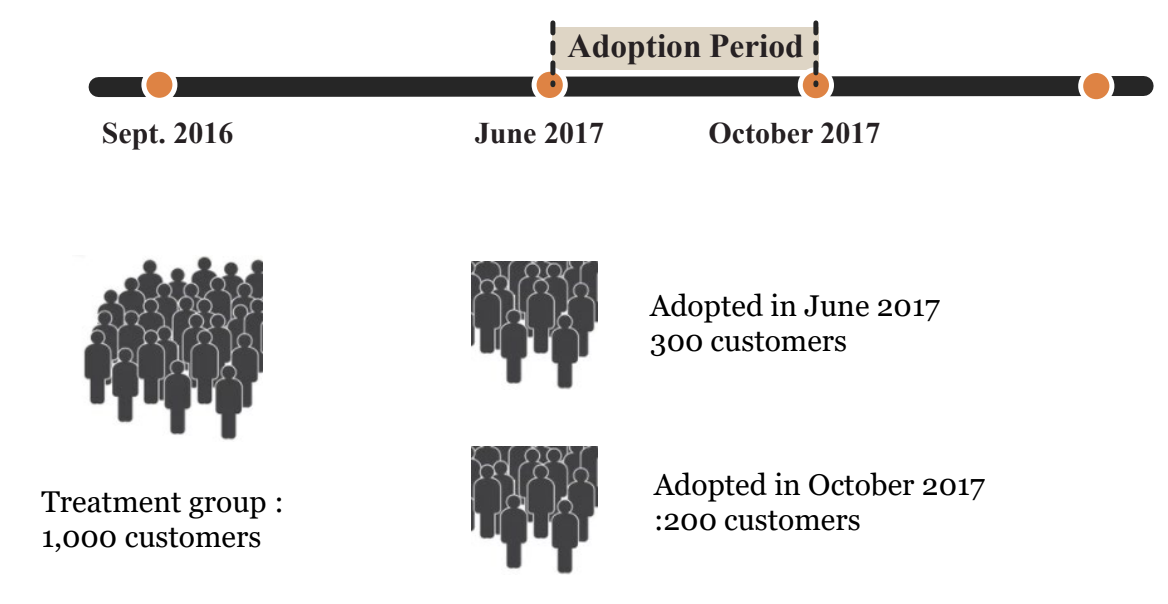
- Control Group: Households who never adopted AI speaker during our research period.
- Treatment Group: Households who adopted AI speaker during our adoption period.
- self-selection에서는 adoption period가 제각각임
- PSM이 observable한 부분을 control
- unobservable → 각각 다른 adoption period를 활용하여 control / treatment group으로 나누기
⇒ robustness check의 방법으로 생각

Result

반응형
'Causal inference' 카테고리의 다른 글
| Chapter 2. 행동 데이터를 이해하는 방법 (2) | 2023.11.25 |
|---|---|
| Chapter 1. 인과-행동 프레임워크 (0) | 2023.11.24 |
| [KSSCI 2021] 인과추론의 데이터 과학 - Session 18 (0) | 2023.10.15 |
| Part 5. Advanced Topics for Analyzing Experiments (0) | 2023.10.12 |
| [KSSCI 2021] 인과추론의 데이터 과학 - Session 17 (0) | 2023.10.12 |


댓글